
How to see what data apps are sending about you
By Ryan · Published 2026-07-28
You can read your own apps' outgoing requests on a stock iPhone, and the surprise is rarely the app's own API — it's everything riding along beside it. Record a session while you use one app, then group the requests by who receives them. The example in this guide is a single POST captured on 2026-07-24 from an app on my phone: 254 milliseconds, a 14,640-byte body, and eight analytics events, five of which were the app reporting which A/B tests I had been sorted into.
Start with the free thing iOS already gives you
iOS has a built-in list of every domain your apps contact, at Settings → Privacy & Security → App Privacy Report. Turn it on and it records, for the last seven days, which domains each app reached and which sensors each app touched. It costs nothing and it's the right first stop.
What it will not show you is a single byte of what was said. No request bodies, no headers, no payloads — just hostnames and counts. Everything interesting in this guide, including the payload below, is invisible to it. To see whether the beacon going to a vendor carries your email address or your A/B test assignments, you have to decrypt the request.
Capture one app, for two minutes, on purpose
A useful capture is short, deliberate, and covers one app. Start a session, open the app you're curious about, do the one thing you want to understand — cold launch, sign-in, a search, opening a paywall — then stop and read it. Two minutes of one app is something you can go through; twenty minutes of general phone use is a pile.
The capture is device-wide, not per-app, so anything refreshing in the background lands in the same session — force-quit the other apps first. The mechanics, certificate and all, are in the guide to inspecting HTTPS traffic without a Mac, and setup takes about a minute.
Most of the destinations aren't the app's servers
In a capture of one indie iOS app on 2026-07-23, five separate organizations appeared behind a single session: PostHog and Google for analytics, Axiom for logging, RevenueCat for subscription state, and Supabase for the actual backend. One of those five is the app. The other four are vendors the developer wired in, each receiving its own stream of events, each with its own retention policy and its own idea of what to do with the data.
Geography comes along for free, because every connection has a remote
IP address. The request below left a phone in Los Angeles and
terminated in AWS us-east-1, in northern Virginia — which
is where the data sat, whatever the app's privacy policy said about
the company's home country.
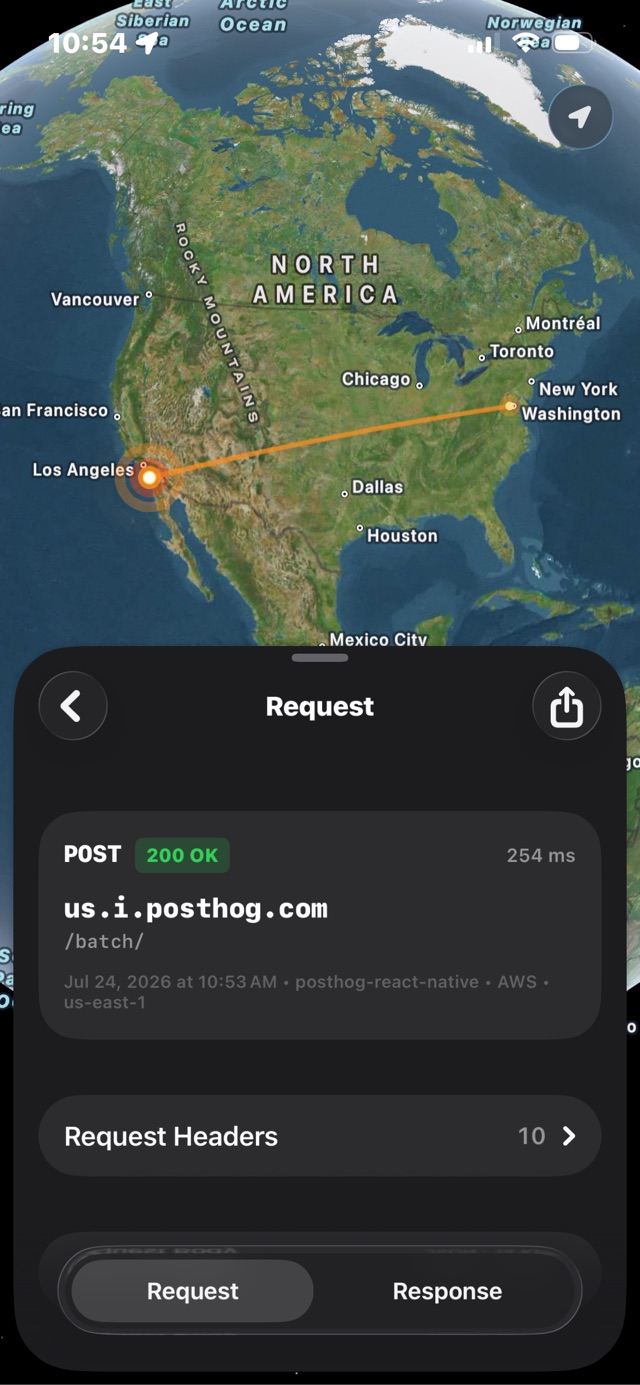
AWS · us-east-1 is northern Virginia. The 10 next to
Request Headers is the count for this exchange.
What one analytics beacon actually contained
The exchange above is a POST to us.i.posthog.com/batch/,
sent by posthog-react-native/4.45.5 from an iPhone 13 Pro
running iOS 26.5.2, answered 200 OK in 254 ms with a
15-byte body reading {"status":"Ok"}. The request body
was 14,640 bytes and held eight events. The first event alone carried
41 properties:
-
The device —
$device_manufacturer,$device_name,$device_type: "Mobile",$osand version,$locale: "en-US", timezone, and$screen_width: 390with its matching height. -
The build — app version, build number, and bundle
identifier, plus
$liband$lib_versionnaming the SDK that sent it. -
The identifiers — a
distinct_idand a$session_id, both UUIDs. Twelve distinct UUIDs appear across the eight events. - The experiment state — the names and current values of 13 feature flags, which turned out to be the bulk of it.
Notably absent: no email address, no phone number, no location, no
contacts, and "$is_identified" : false — the SDK's own
marker that it had not been handed a real user identity. This payload
is pseudonymous. That is what an ordinary analytics beacon looks like,
and it's worth knowing the shape of the ordinary case before deciding
anything is wrong.
Five of the eight events were the app telling a vendor which tests I'm in
Five of the eight events in that batch were
$feature_flag_called — the PostHog SDK reporting that the
app had checked a feature flag. Not a tap, not a screen view, not
anything I did. The app asking itself a question, and then filing a
report about having asked.
Every event in the batch also carried the whole flag map as
$feature/ properties. Thirteen of them, by internal name:
"$feature/featureAppToWeb"                        : false
"$feature/featureDynamicPaywall"                  : "default"
"$feature/survey-targeting-7a03fdcb09-custom"     : true
"$feature/survey-targeting-ac0c78ea07-custom"     : true
"$feature/testAAOnboarding"                       : false
"$feature/testAAOne"                              : false
"$feature/testAAThree"                            : false
"$feature/testAATwo"                              : false
"$feature/testAiChatAgent"                        : false
"$feature/testChokingQuiz"                        : false
"$feature/testDefaultPaywallDP"                   : "in_house"
"$feature/testGBAnnualPricing"                    : false
"$feature/testOnboarding"                         : "onboarding_v3"
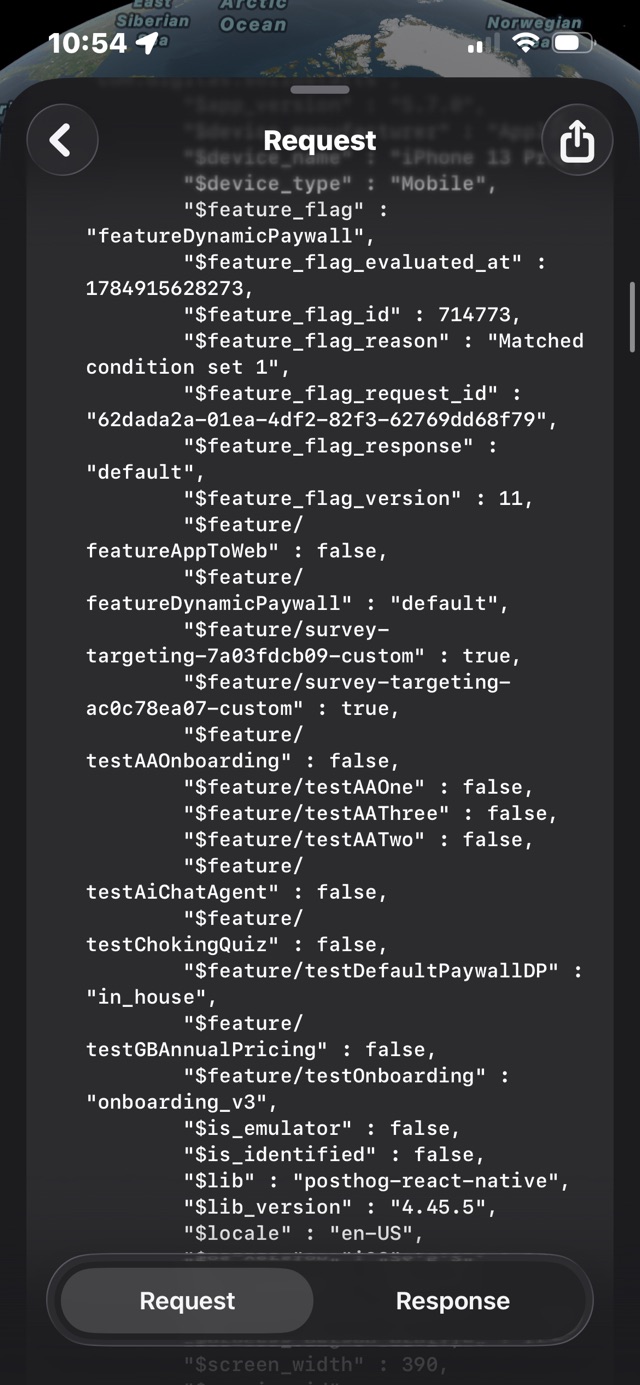
$feature/ keys gives you the app's experiment roster —
including the annual-pricing test and an AI chat agent that has no
visible entry point in the shipped UI.
The flag metadata is more specific than the flag values. This event
recorded "$feature_flag" : "featureDynamicPaywall",
"$feature_flag_id" : 714773,
"$feature_flag_version" : 11, and
"$feature_flag_reason" : "Matched condition set 1" — the
server's explanation of why this phone was bucketed the way it was.
None of this is the app misbehaving, and it isn't about me. Sending the full flag map on every event is how the PostHog SDK is built to work, so that any event can be sliced by experiment later. The size and contents of that payload were decided by a vendor's default, not by anything the developer wrote or anything I tapped. That's the general rule for reading these: the payload usually tells you more about the SDK than about the app, and much more about the SDK than about you.
You can spot an SDK that never sends a request of its own
Some SDKs identify themselves in headers on other vendors' requests, so an inventory built only from hostnames will miss them. The PostHog request above carried two headers that have nothing to do with PostHog:
baggage:      sentry-environment=production,sentry-release=5.7.0,
              sentry-public_key=…,sentry-trace_id=…,sentry-org_id=…
sentry-trace: …
That is
Sentry's distributed tracing, which instruments the app's HTTP client and stamps outgoing
requests regardless of where they're headed. It reveals the crash
reporter in use, the app's release string —
5.7.0 — and the environment name, on a request to an
unrelated company. Read the headers of every request, not just the
bodies, and not just the hostnames.
Which domains belong to whom
Analytics, attribution, and crash-reporting SDKs use a small number of well-known ingest hosts. These are the ones worth recognizing on sight; the User-Agent on the request usually confirms the guess.
-
app-measurement.com— Google. Google Analytics for Firebase event upload. -
firebaseinstallations.googleapis.com— Google. The per-install Firebase identifier. -
graph.facebook.com— Meta. Facebook SDK app events and install attribution. -
api.mixpanel.com— Mixpanel. Product analytics events. -
api2.amplitude.com— Amplitude. Product analytics events. -
us.i.posthog.com,eu.i.posthog.com— PostHog. Product analytics, feature flags, surveys. -
api.segment.io— Twilio (Segment). Event collection, fanned out to other vendors server-side, which is why one host here can mean a dozen recipients. -
*.appsflyer.com— AppsFlyer. Install and campaign attribution. -
app.adjust.com— Adjust. Install and campaign attribution. -
api2.branch.io— Branch. Deep links and attribution. -
*.ingest.sentry.io— Sentry. Crash reports and performance traces. -
sdk.<region>.braze.com— Braze. Messaging, engagement, and user profiles. -
api.onesignal.com— OneSignal. Push notification delivery and device records. -
api.revenuecat.com— RevenueCat. Subscription and purchase state. -
googleads.g.doubleclick.net— Google. Ad requests and conversion tracking. -
analytics.tiktok.com— TikTok. Ads SDK events.
Treat that as a starting point rather than an authority. Vendors add and
retire hostnames, several offer customer-specific subdomains precisely so
their traffic doesn't look like theirs, and a company that proxies events
through its own domain won't appear here at all. The
User-Agent is the more durable signal —
posthog-react-native/4.45.5 names both the SDK and its
version, and it's what Tracer reads to label each request with the
organization behind it, alongside a bundled list of 424 organizations and
1,091 host patterns.
What's ordinary, and what's worth a second look
Most of what apps send is dull, and knowing which parts are dull is what lets you notice the parts that aren't. Ordinary, in the sense of present in nearly every app's traffic:
- Device model, OS version, locale, timezone, screen dimensions, app version and build number, attached to every analytics event.
-
A pseudonymous per-install identifier —
distinct_id,device_id,anonymous_id— plus a session UUID that rotates. - Crash reports on launch, subscription checks on every foreground, and config and feature-flag fetches with the reporting shown above.
Worth stopping on, and worth writing down when you see it:
-
A non-zero advertising identifier after you denied
tracking. With App Tracking Transparency denied,
ASIdentifierManager.advertisingIdentifierreturns00000000-0000-0000-0000-000000000000. A real IDFA in a payload means the prompt was answered yes at some point. - Your email address or phone number going to a vendor rather than to the app's own backend — including as an SHA-256 hash, which is how ad platforms match users across apps and is not anonymization.
- Precise coordinates in a payload for a feature that doesn't need them. Latitude and longitude at five decimal places is about a meter.
- Requests that fire while the app is backgrounded or you aren't using it — visible in a capture as timestamps with no interaction between them.
-
Anything over plain
http://. Rare in 2026, and a real finding when it happens. - A vendor the App Store privacy label doesn't account for. The label lists categories the developer declared; your capture lists who actually received bytes.
What you can do once you've seen it
The controls that exist are narrower than the problem, and it's better to know which is which than to assume the switches do more than they do.
- Turn off tracking globally. Settings → Privacy & Security → Tracking → Allow Apps to Request to Track, off. This zeroes the IDFA for every app. It does not stop analytics, and nothing in the payload above would change.
- Cut Apple's own ad personalization. Settings → Privacy & Security → Apple Advertising → Personalized Ads.
-
Block at the DNS layer with a configuration profile
or an encrypted-DNS provider that filters trackers. It works, it
covers cellular, and it breaks apps unpredictably — attribution SDKs
are sometimes wired into launch paths, and a blocked
graph.facebook.comcan cost you a login button. -
Log out, or delete. A pseudonymous
distinct_idstops being pseudonymous the moment it's joined to an account. Signing out of an app you use casually removes more linkage than any settings toggle. - Send what you found to the developer. Most third-party payloads are SDK defaults nobody reviewed; a specific message quoting the field and the endpoint gets fixed at a rate that surprises people.
What a capture can't tell you
A capture proves what left your phone, on one device, in one session, for one app version. It says nothing about what happens on the far end, how long the data is kept, who it's sold to, or why the developer chose to send it — and a payload is evidence of behavior, never of intent.
The technical gaps are just as important:
- Certificate pinning. Apps that pin reject the inspector's certificate, so those hosts show an IP address and byte counts but no plaintext. Pinning is per-host, so an app's analytics usually still decrypts even when its own API doesn't — and the analytics is the part this guide is about.
- QUIC and HTTP/3 run over UDP and bypass the system proxy entirely, as does anything on a raw socket. Big apps increasingly ship their own QUIC stack.
- Binary payloads. Plenty of SDKs send protobuf or a proprietary encoding. You'll see the request, the size, and the destination, but reading the fields is a separate project.
- Scripted analysis. For diffing sessions across days or running something over hundreds of requests, export to HAR and work on the file at a computer.
FAQ
Can I see what data an app is sending without installing anything?
Partly. iOS has a built-in App Privacy Report at Settings → Privacy & Security → App Privacy Report, which lists every domain each app contacted in the last seven days, plus the sensors and data each app accessed. It shows you who an app talked to but never what it said — there are no request bodies, headers, or payload contents in it. For the domain question it is free, requires no certificate, and is the right first stop.
Does turning off Ask App Not to Track stop apps from sending data?
No. Denying App Tracking Transparency makes
ASIdentifierManager.advertisingIdentifier return the
all-zero UUID 00000000-0000-0000-0000-000000000000, so
an app can no longer read the cross-app advertising identifier.
Analytics keeps working: SDKs generate their own first-party
identifier per install and keep sending device model, OS version,
locale, screen size, app version, and event history to their own
servers. ATT restricts one identifier, not the beacon.
Does an app sending my device model and screen size mean it is tracking me?
Not by itself. Device model, OS version, locale, timezone, and
screen dimensions are attributes shared by millions of phones, and
analytics SDKs attach them to every event by default. What makes a
payload identifying is the stable identifier next to those
attributes — a distinct_id, device_id, or
advertising identifier that persists across sessions and links each
event to the last. Look for the identifier, then ask how widely it
is shared.
How do I tell which company a domain in my traffic belongs to?
Read the User-Agent header first — analytics SDKs usually name
themselves in it, for example
posthog-react-native/4.45.5 or FBiOSSDK.
Vendor hostnames change over time; a self-identifying SDK string is
more stable and more specific than a hostname lookup. Failing that,
the vendor's own documentation lists its ingest hosts, and the App
Store privacy label names the categories of data the developer says
it collects.
Is it legal to inspect the traffic my own phone sends?
This is not legal advice, and the answer depends on where you are. Recording the traffic your own device sends over your own network is ordinary self-inspection, and the same technique is standard practice in mobile development and security research. Separate questions do apply: many apps' terms of service prohibit reverse engineering, captured payloads routinely contain live API keys and session tokens that should not be published, and republishing another person's data is a different matter entirely from reading your own.
Pick one app you use every day, capture two minutes of it, and read every request once. You'll learn more from that than from any privacy policy, and the second app takes ten minutes instead of an hour because the same six vendors keep showing up. If all you want is the list of domains, iOS gives it to you free in the App Privacy Report. To read what's actually inside the requests — the identifiers, the flag maps, the vendor headers riding on someone else's call — Tracer does it on the phone, and names the company behind every host it captures. We publish our own captures in the teardowns, field by field.